
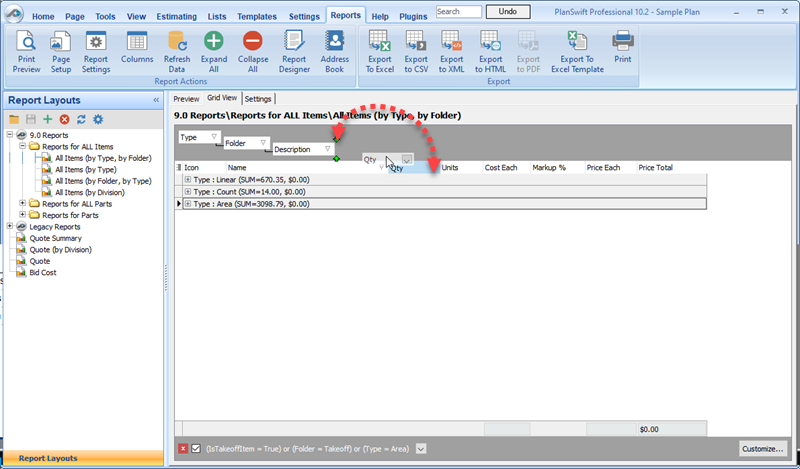
You can group your Report data by the column headings that are visible. The Grouping takes place in the dark grey bar at the top of the report.

Grouping a Report
To group by a certain criteria,
- Click and drag the column heading into the light grey bar.
There is no limit to how many columns you have visible in a report. You may edit your columns by clicking on the Columns button.
To add a new column,
- Click the Columns button,
- Click the green plus (+) button
- Type in the column name
Be sure to set the correct data type when adding your columns.

By default, each column should match a property name inside your items; this is the only way to yield a result.
You can also create a formula for a column by typing it in the Report Columns window.
You can group by any column, and you may have as many groupings as you would like (but don’t group so much that the data becomes useless).
Grouping is a great way to keep Reports clean and organized to make the data readily accessible.
 Report Filters Report Filters | Formatting a Report  |
Related Articles