
The way Typical Takeoff quantities display on the Takeoff Tab changes a bit depending on how the Summary Tab is grouped (by Zone, Page, Area, Type).
On the Summary Tab, the Conditions List displays takeoff quantities for the Typical Page. The green banner explains this and displays how many Repeating (or Virtual Pages) there are.
Compare Takeoff and Summary Tabs
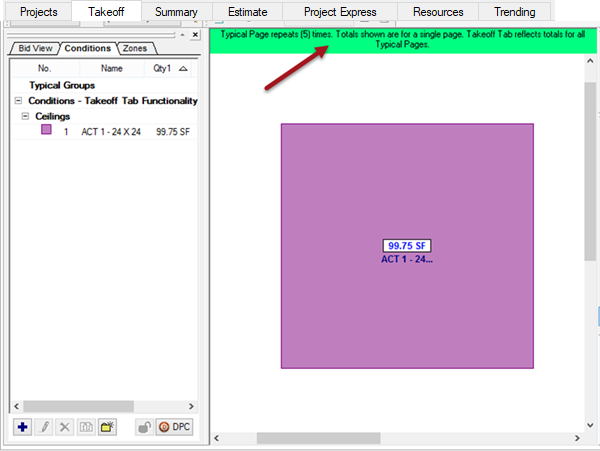
In the example below, on the Takeoff Tab, the Condition Results for a single instance of the Typical Page are shown in the Condition Window (about 100SF) and the green banner indicates 5 Repeating Pages. We've used Virtual Area Assignment to allocate the takeoff across Bid Areas Floor 1 - 5 (covered in Related Articles).
Now, on the Summary Tab, we will see the totals for all Repeating (Virtual) Pages (from the previous example, note the individual “Typical” totals on the Takeoff Tab). The Areas to which each Repeating Page's takeoff is assigned are shown below the Condition and rolled up into the "Multi-Area Total" cell. Area breakdown is only possible if you have configured the "Virtual Page Assignments" as explained in the Related article.

Now, group the Summary Tab by Area to see a slightly different breakdown:

Experiment with the different grouping and view options. You can also export this information and manipulate it in a spreadsheet program (such as Excel). See Related Articles for more information on exporting from On-Screen Takeoff.
 How Typical Groups are shown on the Summary Tab How Typical Groups are shown on the Summary Tab | A Detailed Look at the Estimate Tab  |
Related Articles