
The Specification Positioning dashboard in ConstructConnect Analytics now goes deeper. New charts, tables, a map, and an overlap view show where your products are being specified by trade, state, and project size, as well as how that changes over time. This release also adds a Square Footage column to project downloads across all three Analytics dashboards.
What's New?
-
Specification Metric Tiles: Two tiles at the top of the dashboard, Total Project Count and Total Project Value, show how many projects match your current search tags and filters as well as their combined value. Both update when you click Refresh after changing your selections.;
-
Specification Division Chart: See project counts by two-digit CSI division (for example, 03-Concrete or 05-Metal), shown alongside the existing Top 5 Categories chart. Click any section of a bar to open the projects behind it.;
-
Specification Share by State: A state-by-state version of the Specification Comparison Table. States are ranked by total number of specifications, with the number of projects and the specification share percentage for each search tag. Download it as a CSV file;
-
Project Value Distribution by Search Tag: A bar chart showing specification volume by project value range, from under $500K to $100M+, with each bar divided by search tag. Use it to see whether your products lean toward being specified on larger or smaller jobs.;
-
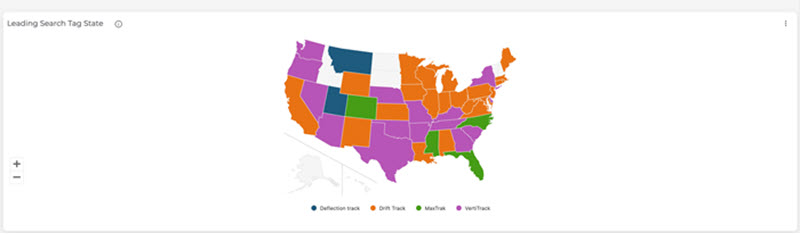
Specification Map: Each state is colored-coded to align with its top-specified search tag. Hover over a state to see all of your tags and their project counts.
-
Specification Period-over-Period Table: See the annual specification count for each search tag across the last three complete years, with the year-over-year percentage change. The table always shows the full three years, no matter what Date Range you choose. Download it as a CSV file.;
-
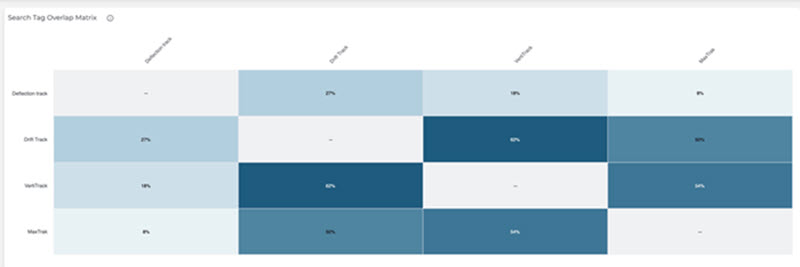
Search Tag Overlap Matrix: A grid showing how often your selected search tags are specified on the same projects, so you can see which tags tend to show up together. Each square shows the percentage of projects that mention both tags. Darker squares mean more overlap.
-
Square Footage column on project downloads: Project lists and downloads on all three dashboards now include a Square Footage column, shown as a whole number (for example, 24,500). It's blank when the information isn't available, which is common for civil projects.
Highlights and key capabilities
-
Drill-down: Click a section of a bar in the Specification Division chart to open the list of projects behind it.;
-
Downloads: Download Specification Share by State and the Specification Period-over-Period Table as CSV files.;
For more detailed information, read the full article, ConstructConnect Analytics Specification Positioning Dashboard.