
ConstructConnect Analytics Specification Positioning Dashboard
- Before you begin
- Primary Specification Positioning workflows
- Open the Specification Positioning dashboard
- Choose search tags and filters
- Review the AI summary
- Project Breakdown
- Top 5 Categories
- Review Specification Trends and the Comparison Table
- Refine the view
- Open company and project details
- Export and share specification results
- Getting help from inside Analytics
Use the Specification Positioning dashboard to see how often your products and competing products are specified across projects and markets. It turns search-tag-based specification activity into a focused view of architects, firms, and locations your team can act on—so you can protect wins and decide where to invest more effort.
Before you begin
Make sure you:
- Have search tags set up in ConstructConnect Project Intelligence that align to your brands, product lines, and competitors.
- Know which time periods, geographies, and project categories you want to compare (for example, “roofing specifications in the Northeast over the last 12 months”).
Primary Specification Positioning workflows
Use the Specification Positioning dashboard to:
- Track where brands or product lines are being specified.
- Understand how your products are performing across markets.
- See where competing products are being specified.
- Review how specification activity changes by geography.
- See how specification share changes over time across search tags (products, product lines, or competitors).
The sections below walk through these workflows step by step.
Open the Specification Positioning dashboard
- In the ConstructConnect Platform, click the Analytics icon (bar chart) in the left-hand navigation.
![]()
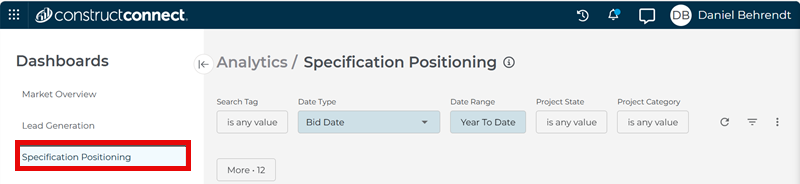
- In the Analytics workspace, select Specification Positioning.
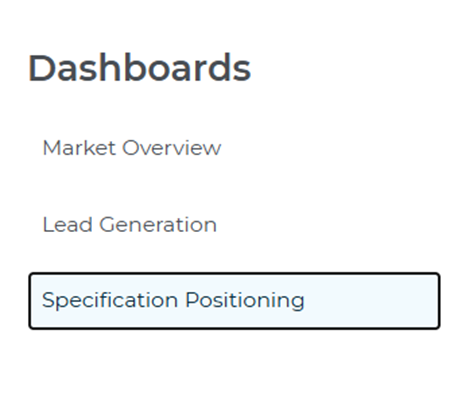
- Use the sidebar menu to move between Market Overview, Company Targeting, and Specification Positioning as needed.
Choose search tags and filters
Use the filters at the top of the dashboard to focus on the products, competitors, locations, and project activity you want to review.
- Search Tag — Start by selecting up to 10 tags that represent the products, brands, or competitors you want to track. These tags determine which specification mentions appear throughout the dashboard.
- Date Type — Choose the project date you want to analyze, such as Start Date or Bid Date.
- Date Range — Select the current period and comparison period so you can see how specification activity is changing over time, like Yesterday, Last 7 Days, or Year to Date.
- Project State — Focus on the territories you care about.
- Project Category — Narrow the view to the categories most relevant to your portfolio (e.g. Multi-Residential, Educational, or Hotel/Motel).
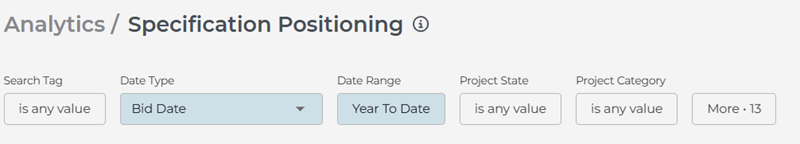
For additional filters, click More to refine the view
- Division — Filter by the two-digit CSI division that best matches your products or market focus, like 03-Concrete or 05-Metal.
- Sector — Focus on the market sectors most relevant to you, such as Private, Public-City, or Public-Federal.
- Project Subcategory — Narrow the view within a broader project category, such as selecting Apartments or Condominiums.
- Company Name — Jump to a specific company when you already know who you want to review.
- Company Role and Company Industry — Focus on the firms that matter most to your strategy, Architects, Contractors, or, more specifically, Asphalt Paving Contractors.
- Project Type — Limit results to the types of projects you want to analyze, such as Remodeling, Paving, or Demolition.
- Project Stage — See whether specification activity is concentrated in planning, bidding, or post-bid work (e.g. Design, GC Bidding, or Post-Bid).
- Project City and Project County — Refine the view to more specific project locations.
- Company State, Company County, and Company City — Narrow the results based on where companies are located.

As you change your search tags or adjust these filters, the metrics, charts, and tables on the page update automatically.
Review the AI summary
The AI Summary at the top of the dashboard provides a quick overview of how specification activity is behaving in your current view.
Use it to:
- See which products, competitors, or categories stand out.
- Confirm that you are focused on the right time periods and locations.
- Capture a short explanation for product reviews, territory meetings, or leadership reports.
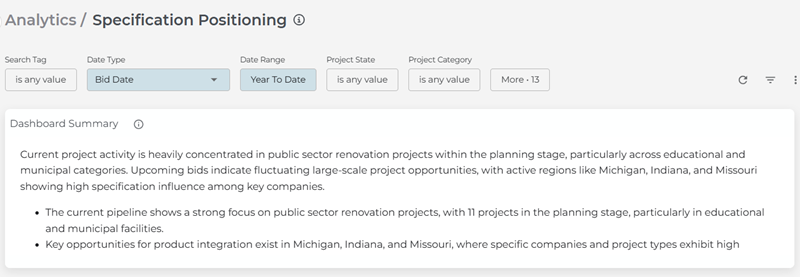
The summary updates automatically whenever you change your search tags or other filters, so it always reflects the current view on the screen.
Project Breakdown
Use the charts in this section to quickly spot patterns in specification activity.
This section includes three separate donut charts:
- Project Type — Shows how specification activity is distributed across project types in your current view.
- Project Stage — Shows how specification activity is distributed across planning, bidding, and post-bid projects.
- Project Sector — Shows how specification activity is distributed across market sectors.
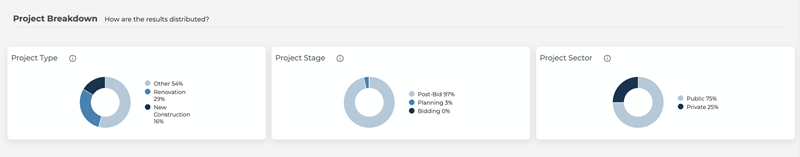
These charts showcase the categories with the highest specification volume in your current view.
In them, you can:
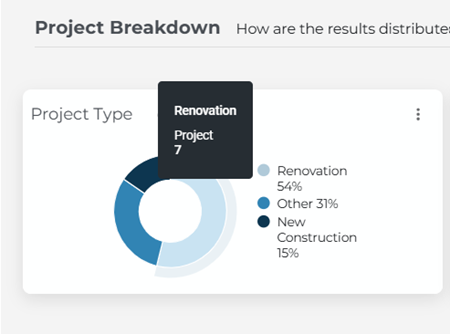
- Hover over a chart element to see exact counts of project types.
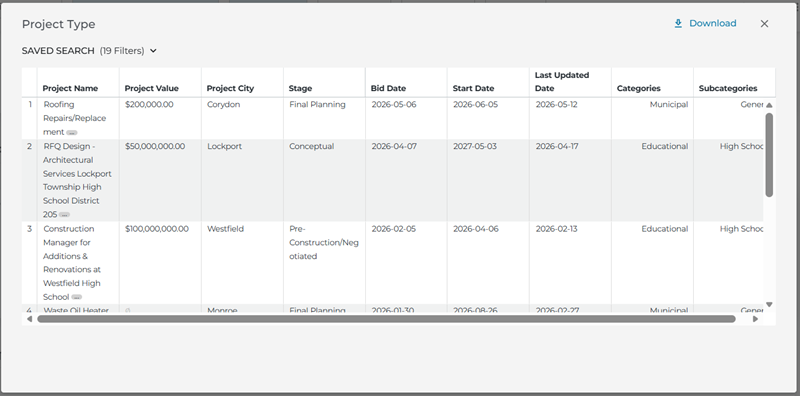
- Click on any wedge to open the projects that make up that portion of the chart.
Top 5 Categories
You can also use this horizontal bar chart to see which project categories account for the most specification activity in your current view. It ranks the five categories with the highest specification counts across your selected search tags.
Each search tag has its own color, so you can quickly see how much of each project type comes from each tag.
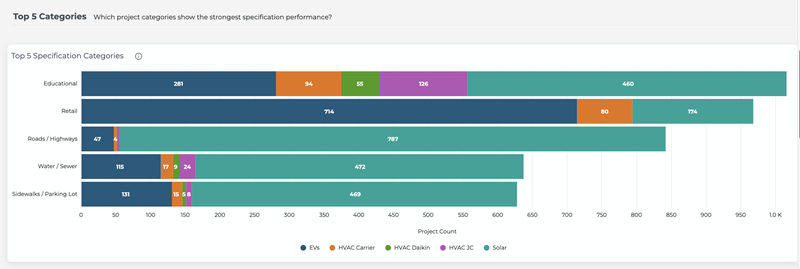
Just like the Project Breakdown section, you can hover over or drill-down into chart elements to see exact values or individual project lists.
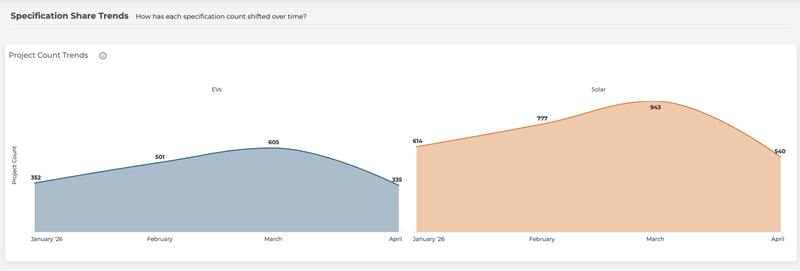
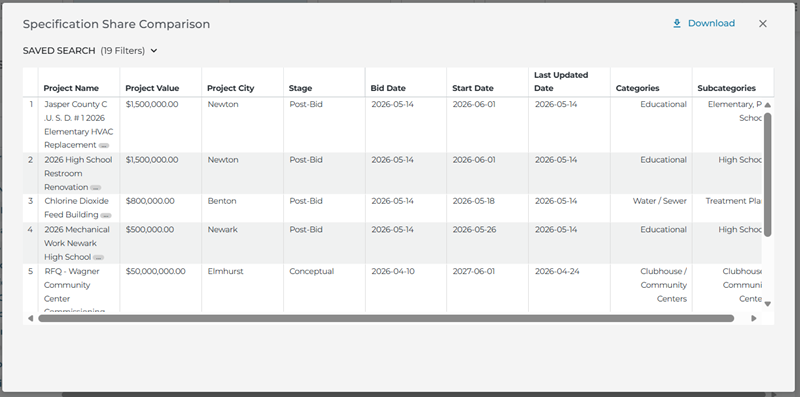
Review Specification Trends and the Comparison Table
Start with Specification Trends chart. It shows how specification counts and share change over time for each selected search tag in the current period versus the comparison period.
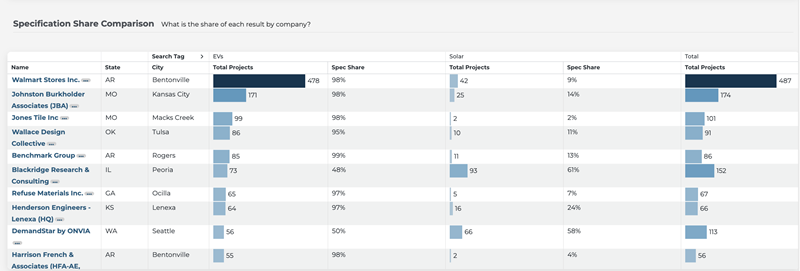
Then use the Specification Comparison Table to compare tags side by side and see how your products compare with competing products.
Sort the table
- Click a column header to sort in ascending or descending order.
(Screenshot placeholder) - Start by sorting Spec Share or Total Projects to see where your specification activity is highest and where it is lower than expected.
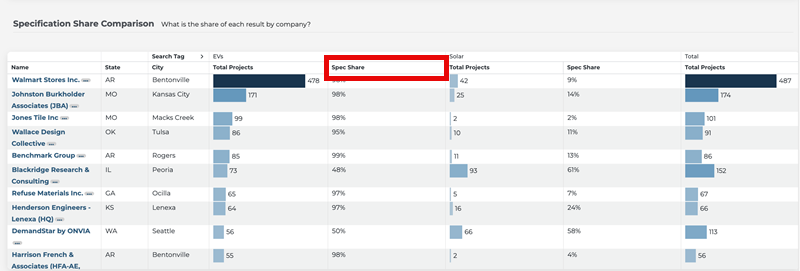
Note: Because some projects match multiple search tags, specification counts and percentages may add up to more than 100%. The Total row counts unique projects only. Treat the percentages as a reference for comparing tags, rather than an exact measure of total specification share
Use the table to:
- Track mentions by seeing which companies or architects most often specify a brand or product tag.
- Compare products by reviewing Specification Share across tags.
- Monitor competition by focusing on competitor tags and the companies that specify them most often.
Refine the view
If the results do not look right, update your search tags or adjust the date, location, category, or stage filters.
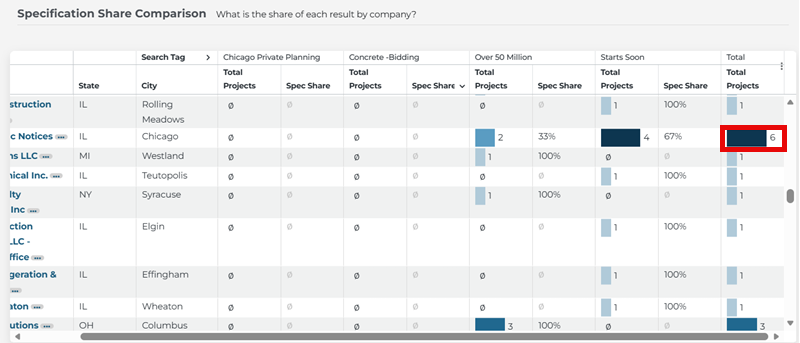
Click any row in the table to open the project list behind those counts.
Drill into details
- Click on any bar in the Total Projects column to see the list of projects that contribute to those specification counts.
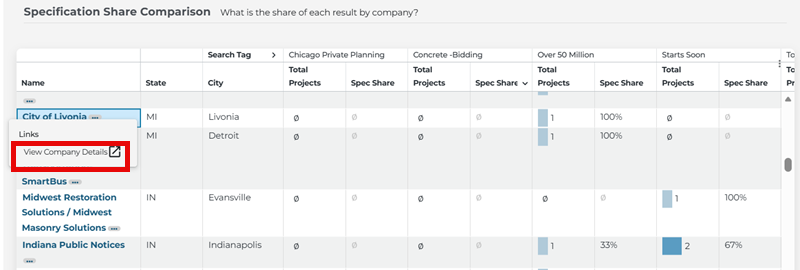
Open Company and Project details
When you want more context about a specific architect, manufacturer, or firm:
- Click the company name in the Comparison Table.
- On the Company Details page in Project Intelligence, review project counts by stage, category mix, and basic location/contact details.
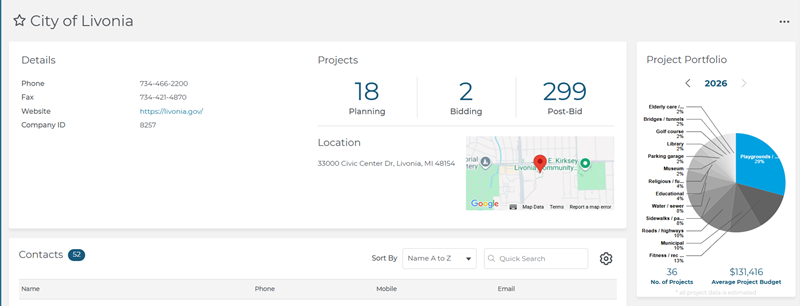
- Open associated projects or documents if you need more information before deciding what to do next.
To learn more about the Company Details page, check out this brief article: Understanding the Company Details Page in Project Intelligence.
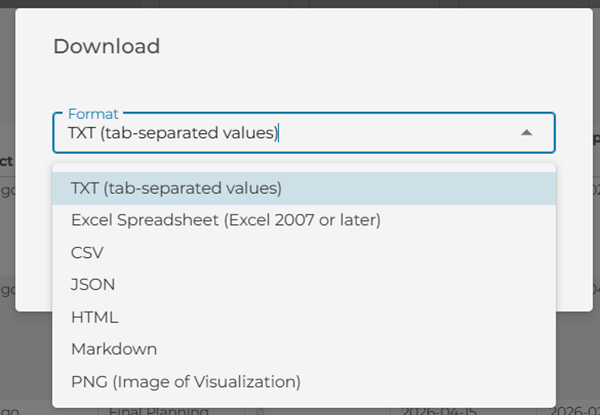
Export and share specification results
After reviewing your filters, tables, and charts:
- Use the three-dot menu on any dashboard to:
- Download the comparison table as a CSV or Excel file.
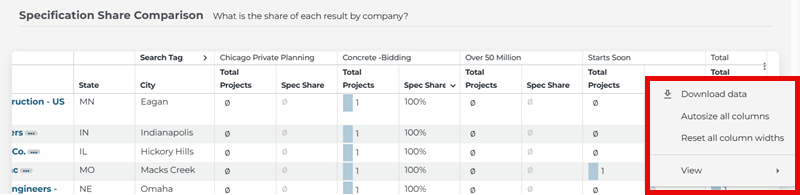
- Use these exports:
- In product and territory review meetings
- Build lists for campaigns and follow-up outreach
- Share performance summaries with leadership or other teams.
Exports use your current search tags and filters, so the data you download matches exactly what you see on the dashboard.
Getting help from inside Analytics
The Specification Positioning dashboard includes built-in help so you can learn features as you use them:
- Use the speech bubble icon in the bottom right corner of the screen to send a question to our support team (select Project Intelligence in the Product Name drop-down for questions involving Analytics).
- Look for guiding questions in chart subtitles (for example, “Which construction categories drive the most activity and value?”) to understand what each chart is showing.
- Hover over information (i) icons on metrics and charts to see definitions and calculation methods.
If you need additional help, search for “Analytics” or “Specification Positioning” in the ConstructConnect Help Center.
 ConstructConnect Analytics Company Targeting Dashboard in Project Intelligence Document Search in ConstructConnect Project Intelligence - Training Video
Related Articles
ConstructConnect Analytics Overview in Project Intelligence
ConstructConnect Analytics Market Overview Dashboard in Project Intelligence
ConstructConnect Analytics Company Targeting Dashboard in Project Intelligence