
ConstructConnect Analytics Overview
- Finding the Analytics dashboard
- Understanding the dashboards
- Market Overview dashboard
- Company Targeting dashboard
- Specification Positioning Dashboard
- Explore project and company details
- Stay in one workflow
- Access help from inside Analytics
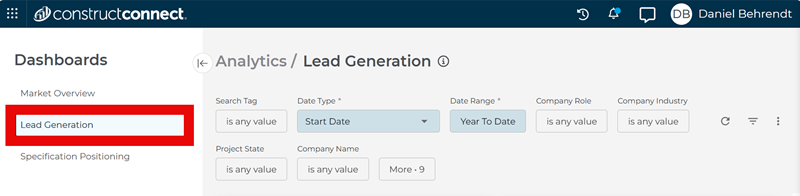
Until recently, the Company Targeting dashboard was called Lead Generation. Many of the visuals below still say ‘Lead Generation’ but will be replaced shortly.
ConstructConnect Analytics gives you a clear view of what is happening in your markets so you can decide where to focus, who to call, and how your products are performing. It brings together multiple years of verified project data into multiple focused dashboards that turn activity into opportunity.
Use Analytics to:
- Spot trends in project activity and market demand
- Build smarter data-enriched outreach lists for your sales team
- Understand how often you and your competitors are specified
- Prepare for business reviews and planning conversations with data, not guesswork
- Quickly capture the story behind the charts with AI-generated summaries that always reflect your current filters.
Finding the Analytics dashboard
Content
The Analytics dashboards live in the ConstructConnect Platform sidebar. If your account includes Analytics, you’ll see an Analytics icon (bar chart) in the left-hand navigation.
- Click the Analytics icon to open the Analytics workspace.
![]()
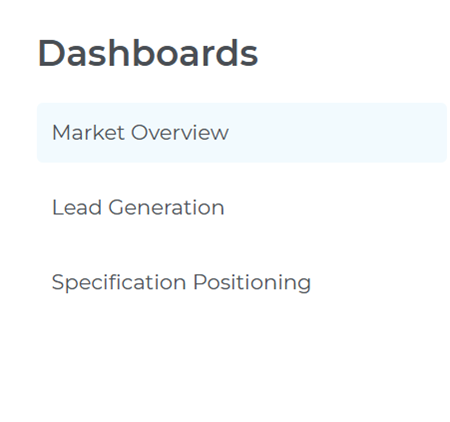
- Choose the dashboard that fits what you want to do:
- Market Overview
- Company Targeting
- Specification Positioning
- Use the sidebar to switch between dashboards at any time.
Understanding the dashboards
Content
Each Analytics dashboard is designed to answer a different set of core questions and support a specific part of your workflow.
Across all dashboards, the filters at the top of the page control what appears in every tile and in the AI-generated summary.
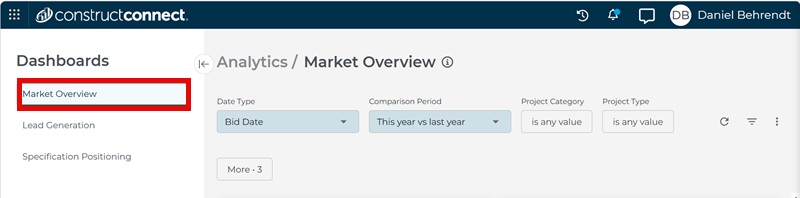
Market Overview Dashboard
Content
(e.g., “Where is the market shifting?”)
Use the Market Overview dashboard to understand how overall project activity is changing across categories, locations, and time periods.
With this dashboard, you can:
- See total project counts and value across your selected markets
- Compare activity across regions and segments to see where demand is growing or slowing
- Track trends over time so quarterly business reviews and planning conversations start with data, not anecdotes
- Spot emerging categories or geographies that may need new investment or coverage
Company Targeting Dashboard
Content
(e.g., “Who should I call next?”)
Use the Company Targeting dashboard to turn project activity into a prioritized contact list for your reps.
With this dashboard, you can:
- Pinpoint high activity accounts. See which companies are most active in the markets selected by your search tags and filters
- Build precision contact lists by filtering contacts by location, role, stage, and engagement.
- Find new-to-you prospects — firms doing work in your space where you have little or no current relationship
- Spot cross-sell opportunities where customers are using some of your products but not others
- Focus on planning-stage projects where you can still influence specifications and relationships
- Use the Bid Date and Start Date filters to focus on projects within the timeframe that matters most to your team.
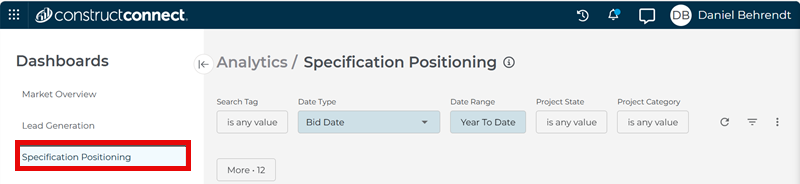
Specification Positioning Dashboard
Content
(e.g., “How are our products performing?”)
Use the Specification Positioning dashboard to understand how often you, and your competitors, are being specified across projects and markets.
With this dashboard, you can:
- Track specification activity for your products over time and compare it to key competitors
- Target segments where competitors dominate, so you can refine coverage, campaigns, or messaging
- See where market share is shifting by product, architect, geography, or project type
- Strengthen high-value relationships with architects and firms who specify you most often
Explore project and company details
Content
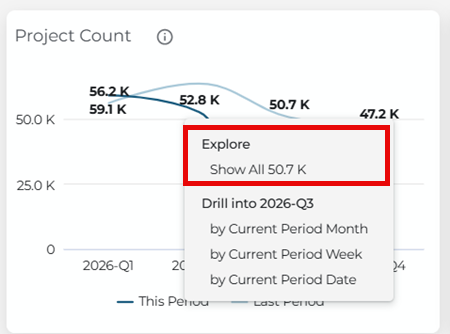
Click a tile or chart element to view the related project and company details
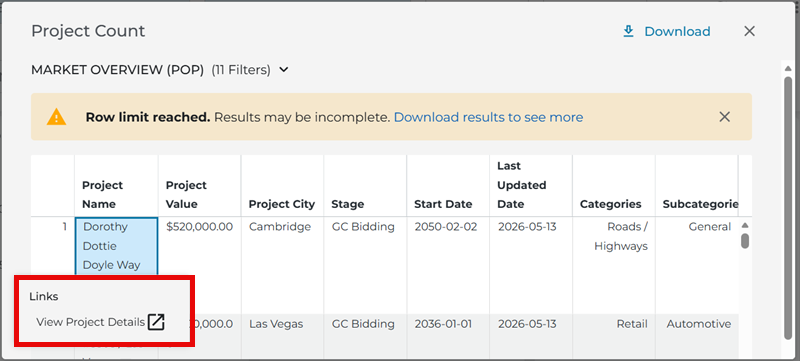
- View a full list of projects that match your current filters
- Click on individual project names to see more detailed information and contacts on the Project Details Page and Company Details Page
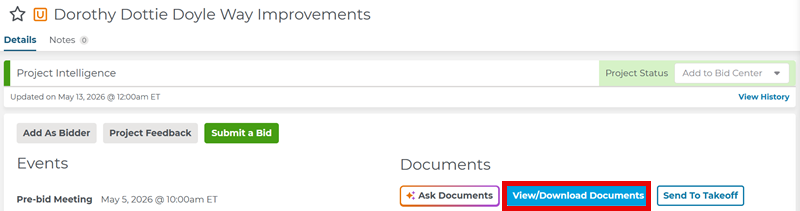
- Open project documents and search for keywords within them using the Document Viewer.
Stay in one workflow
Content
Explore high-level patterns, then dig into the exact projects, companies, and documents your team needs.
You can also click bars, map regions, or value ranges in charts (for example, Top Categories, geographic maps, or Value Distribution) to jump directly to the filtered project list behind that visualization
Access help inside of Analytics
Content
Each dashboard includes built-in help to guide your workflow and answer questions as you explore
- Go to the three-dot menu at the upper right of the screen to review the specific help page to access detailed help articles.
- Use guiding questions in section headings (for example, “Which companies have the most activity?”) to understand what each chart or list shows
- Hover over ‘i’ information icons on charts and metrics to see definitions and calculation methods.
Still have questions?
Search for “Analytics” or contact Support through the ConstructConnect Help Center.
 Working with Saved Project Searches in Project Intelligence ConstructConnect Analytics Market Overview Dashboard in Project Intelligence
Related Articles
ConstructConnect Analytics Market Overview Dashboard in Project Intelligence
ConstructConnect Analytics Company Targeting Dashboard in Project Intelligence
ConstructConnect Analytics Specification Positioning Dashboard in Project Intelligence