
ConstructConnect Analytics Market Overview Dashboard
- Before you begin
- Primary Market Overview workflows
- Open the Market Overview dashboard
- Refine the market view
- Review the AI summary
- See where activity is concentrated
- Using Market Trends and key metrics
- Top 5 performing categories
- Value Distribution
- Download and share dashboard results
- Getting help from inside Analytics
Use the Market Overview dashboard to see how project counts and project value are changing across locations, categories, and time periods. It is designed for planning conversations and reviews, so you can show “what’s changing” in your markets with live project data instead of static spreadsheets.
Before you begin
Content
Make sure you:
- Know which time window you want to analyze (for example, “last 12 months vs. prior 12 months”).
- Have a clear idea of which locations, trades, and project types you want to focus on.
Primary Market Overview workflows
Content
Use the Market Overview dashboard to:
- Explore new geographies and markets.
- Understand changes in a specific market.
- Quickly check specific questions about a territory, category, or time period
The sections below walk through these workflows step by step.
Open the Market Overview dashboard
Content
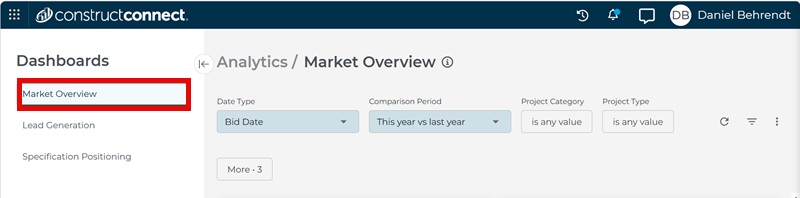
In the ConstructConnect Platform, click the Analytics icon in the left-hand navigation
- In the ConstructConnect Platform, click the Analytics icon in the left-hand navigation.
![]()
- In the Analytics workspace, select Market Overview.
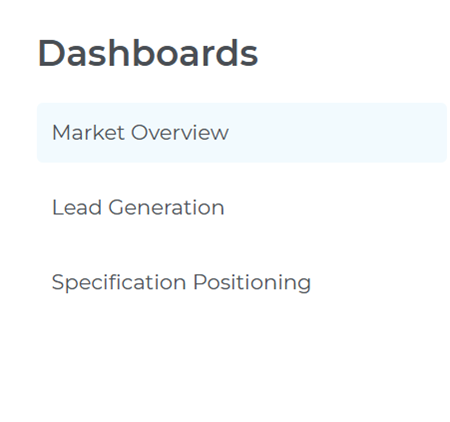
Use the sidebar menu to move between Market Overview, Company Targeting and Specification Positioning as needed.
Refine the market view
Content
Use the filters at the top of the dashboard to focus on the market conditions most relevant to you.

- Date Type — Choose the project date you want to analyze, such as Start Date or Bid Date.
- Comparison Period — Pick the time comparison you want to review, such as This Year vs. Last Year or This Month vs. Last Month.
- Project Category — Focus the view on the categories that matter most to your market (e.g. Multi-Residential, Educational, or Hotel/Motel).
- Project Type — Narrow the results to the kinds of projects you want to review, such as Site Work, Remodeling, or Demolition.
- Division — Filter to the CSI division that best matches your portfolio or trade focus, like 03-Concrete or 05-Metal.
For additional filters, click More
- Sector — Focus on the parts of the market that matter most to your business, like Private, Public-City, or Public-Federal.
- Project State — Limit results to the states you cover.
- Project Subcategory — Get more specific within a broader category, such as selecting Apartments or Condominiums.
- Project Stage — Focus on projects at the stages most relevant to your planning. (e.g. Design, GC Bidding, or Post-Bid).

As you adjust these filters, the metrics, charts, and map update automatically.
Review the AI Summary
Content
The AI Summary at the top of the Market Overview dashboard gives you a short narrative of what is happening in the filtered view.
Use it to:
- Capture a quick headline and two or three key bullets to use in leadership meetings.
- Confirm which locations, categories, or project types are growing or slowing.
- Identify segments you may want to explore in more detail.
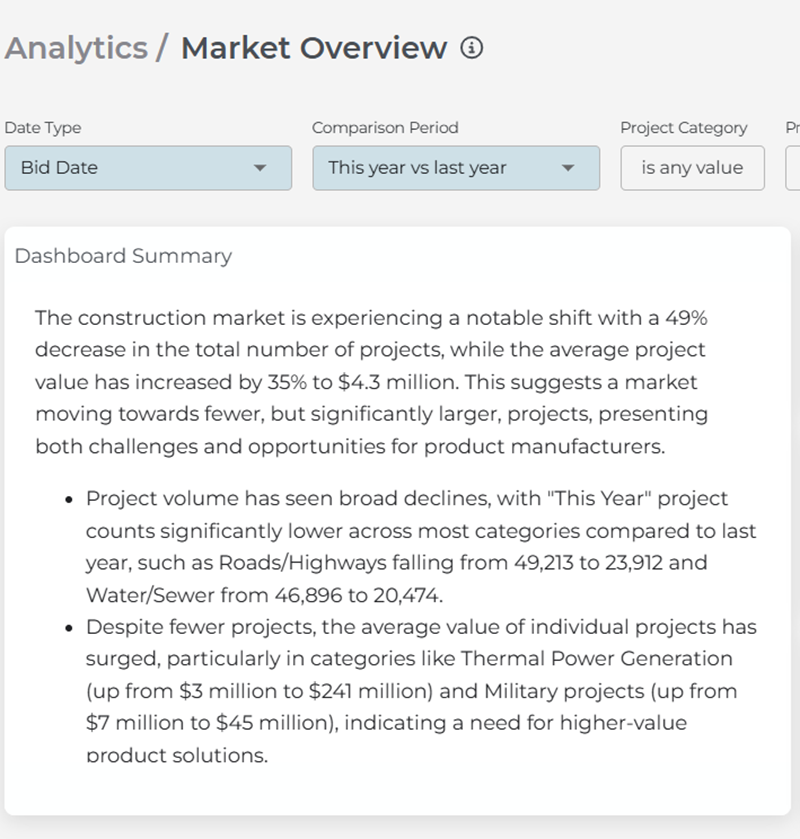
The summary refreshes automatically whenever you change filters or the underlying data updates.
Use this section when you want to explore new territories or see which parts of a market are most active.
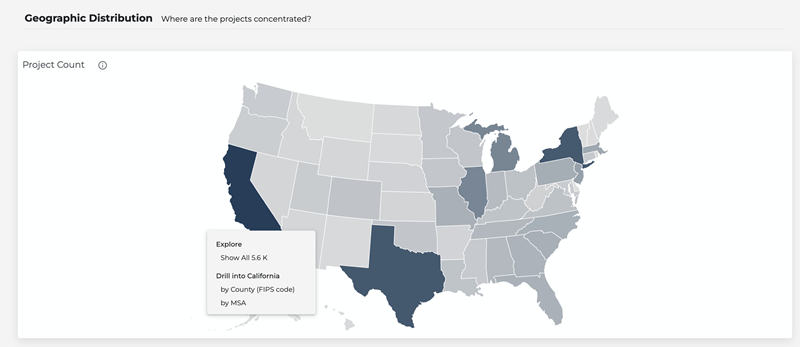
See where activity is concentrated
Use this section when you want to explore new territories or see which parts of a market are most active.
Map view
- Review the state-level colored map by project count to see which states have more or fewer projects.
- Click a state or province to:
- View which counties or metro areas (aka MSAs) have more or fewer projects.
- Open a project list filtered to that geography.
Using Market Trends and key metrics
Content
Use this section when you want to understand how a specific market is changing over time.
The top tiles and trend charts show how overall activity is changing over time.
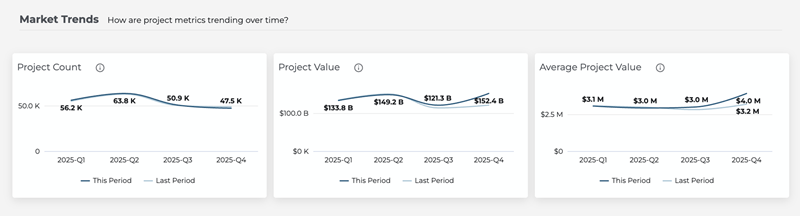
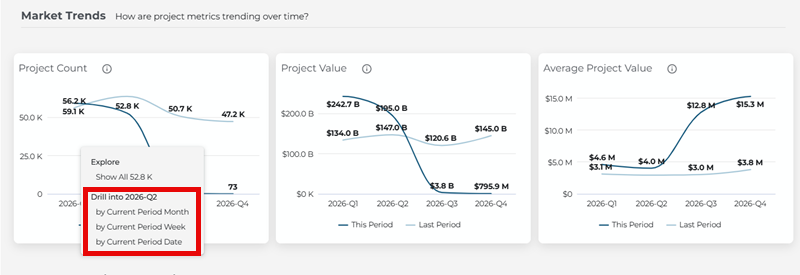
Market Trends
- Line charts show how project count, total value, and average project value change by percentage over time for both the current period and the comparison period.
- Project count – Total number of projects in your filtered view.
- Project value – Combined reported value of those projects.
- Average project value – Typical project size in terms of cost.
- Darker shading will always reflect the current period.
- The difference between the two lines helps you see whether activity is increasing, decreasing, or stable.
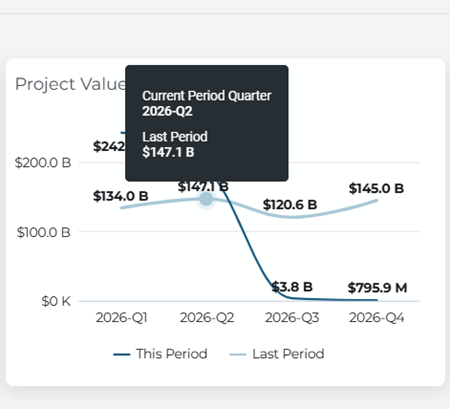
Hover over any point on a chart to see exact values for that period.
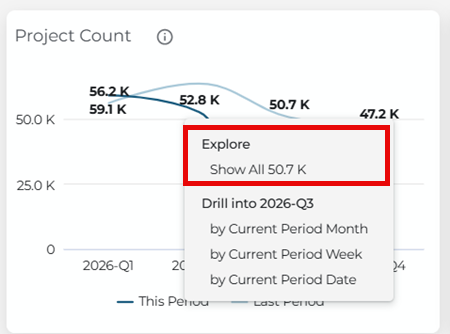
Drill down to projects
By clicking on the line points within the chart, you can open the list of projects that match your current filters for that slice of the data.
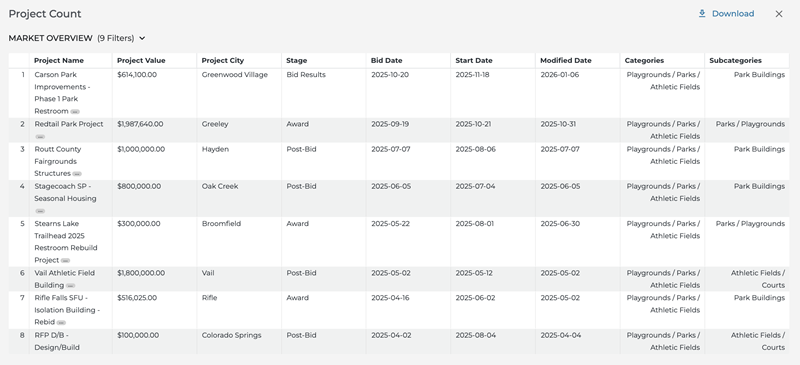
Click on a project name to open the Project Details page in ConstructConnect Project Intelligence, where you can:
- See all participating companies and their roles.
- View attached documents and search within them.
- Review additional attributes needed for deeper analysis.
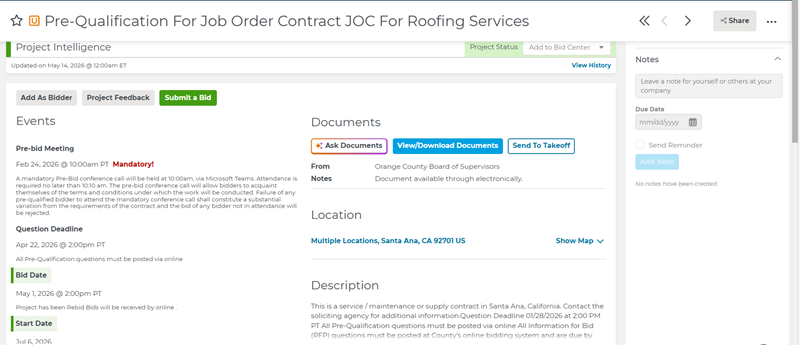
If you’d like more details on how to interpret info on the Company Details Page, take a look at this brief article: Understanding the Company Details Page in Project Intelligence.
You can also translate any line of data into a bar chart, for three different comparison periods
- Current Period Month
- Current Period Week
- Current Period Date
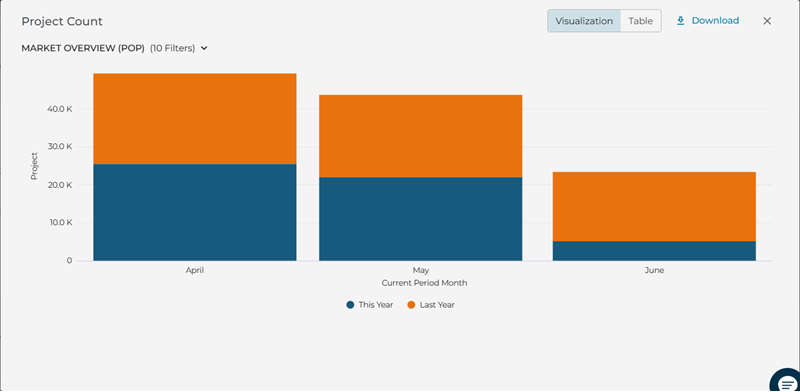
As above, you can open full list of projects by clicking the part of the graph matches the data you’d like to see.
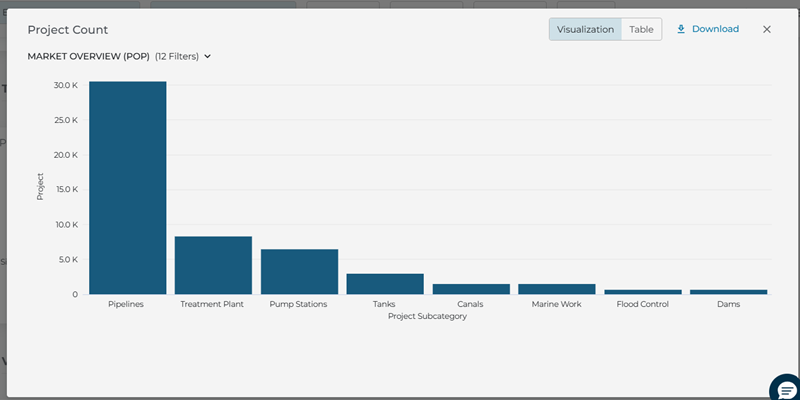
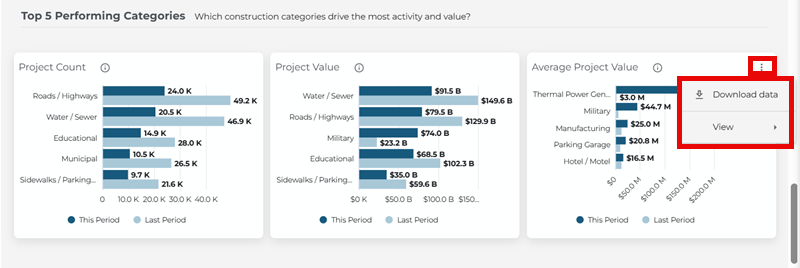
Top 5 Performing Categories
Content
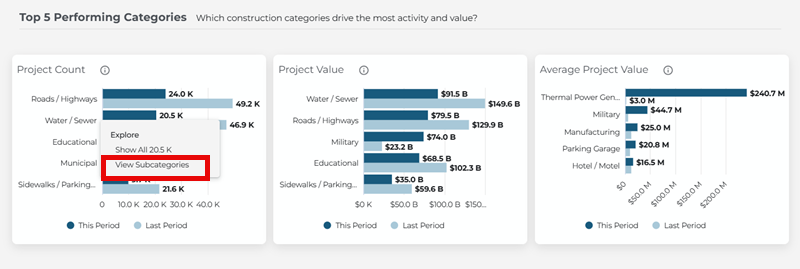
View horizontal bar charts that show:
- Project Count — Shows which categories have the highest number of projects in your current view.
- Project Value — Shows which categories have the highest total project value.
- Average Project Value — Shows which categories have the highest average project value.
Click any bar in the Top Categories chart to see how that category breaks down by subcategory. Click a subcategory to open the related list of projects, so you can move from high-level category patterns to more specific data in a couple of steps.
Value Distribution
Content
Use the value distribution chart to see how projects are grouped across value ranges (for example, from under $500K to $100M+), and how that pattern compares to the previous period.
Each bar shows this period side by side with the comparison period so you can see where project value is concentrating or shifting -click any bar or value band to drill into the list of projects in that range.
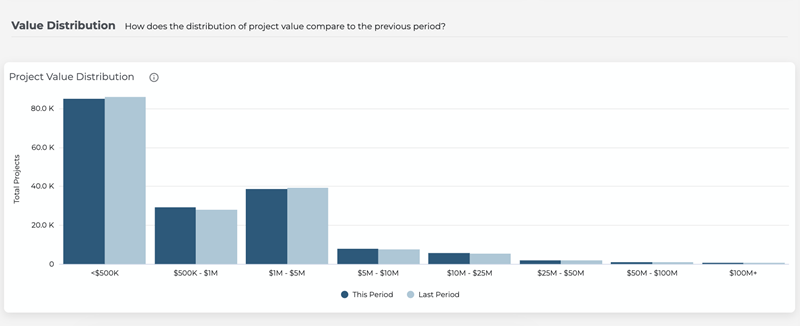
Just like in previous sections, you can hover over any chart element to see an exact value or click on it to open a list of individual projects.
Download and share dashboard results
Content
Use this section to share your market view or move it into other tools.
After you’ve set up the Market Overview dashboard with the date, location, and category filters you need for a specific meeting or analysis:
- Use the Download or Export options from charts and tables to:
- Download chart images for presentations.
- Export project lists (up to the supported limit) to CSV or Excel for deeper analysis.
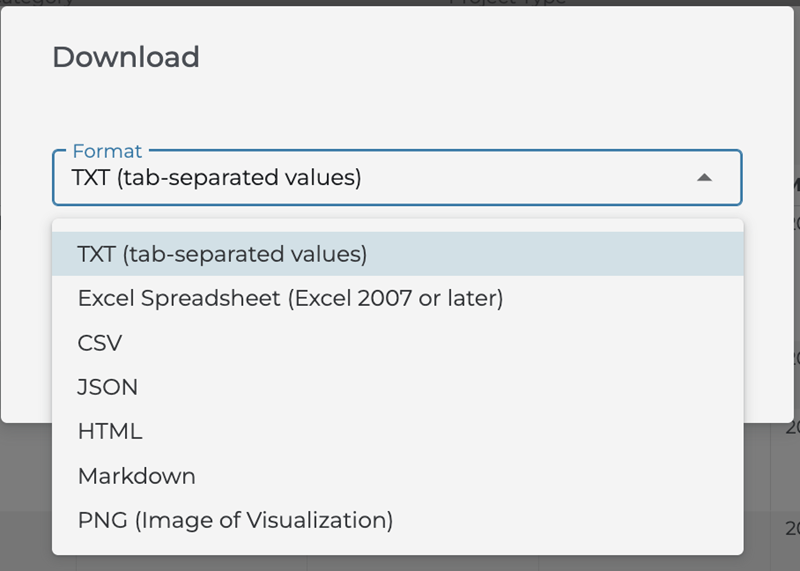
- Include these exports in:
- Territory and market reviews.
- Strategic planning decks.
- Internal memos or reports that need project-based evidence.
Exports use your current filters, so the files you download match exactly what you see on the dashboard.
Getting help from inside Analytics
Content
The Market Overview dashboard includes built-in help so you can learn features as you use them:
- Use the speech bubble icon in the bottom right corner of the screen to send a question to our support team (select Project Intelligence in the Product Name drop-down for questions involving Analytics).
- Look for guiding questions in chart subtitles (for example, “Which construction categories drive the most activity and value?”) to understand what each chart is showing.
- Hover over information (i) icons on metrics and charts to see definitions and calculation methods.
If you need additional help, search for “Analytics” or “Market Overview” in the ConstructConnect Help Center.
 ConstructConnect Analytics Overview in Project Intelligence Constructconnect Analytics Lead Generation Dashboard in Project Intelligence
Related Articles
ConstructConnect Analytics Overview in Project Intelligence
ConstructConnect Analytics Company Targeting Dashboard in Project Intelligence
ConstructConnect Analytics Specification Positioning in Project Intelligence