
ConstructConnect Analytics Company Targeting Dashboard
- Before you begin
- Primary Company Targeting workflows
- Open the Company Targeting dashboard
- Choose search tags and filters
- Review the AI summary
- Using the Target Company table
- Open company details
- View activity by category and momentum
- Export and share your company list
- Getting help from inside Analytics
Use the Company Targeting dashboard to turn project activity into a list of high value companies your reps can act on immediately. It uses your search tags and filters to prioritize those companies, complete with project stage details and visibility into the types of work each company is pursuing—so your reps know exactly where to focus.
Until recently, the Company Targeting dashboard was called Lead Generation. Many of the visuals below still say ‘Lead Generation’, but will be replaced shortly.
Before you begin
Make sure you:
- Have search tags set up in ConstructConnect Project Intelligence for the markets, products, or competitors you care about.
- Know which territories, roles, and project stages you want to focus on (e.g., “planning-stage architects in Illinois”).
- To find work your reps can act quickly, focus on planning and bidding stages.
- For longer-term strategy and relationship building, include post-bid and awarded stages to see who is winning and where.
If you’d like more information on how search tags work, check out the following article: Working with Saved Searches in Project Intelligence.
Primary Company Targeting workflows
Open the Company Targeting dashboard
- Build a prioritized company list for outreach.
- Refine that company list as you learn more.
- Share the company list with your team or CRM.
- Look up and evaluate a specific company.
The sections below walk through these workflows step by step.
Open the Company Targeting dashboard
- In the ConstructConnect Platform, click the Analytics icon (bar chart) in the left-hand navigation.
![]()
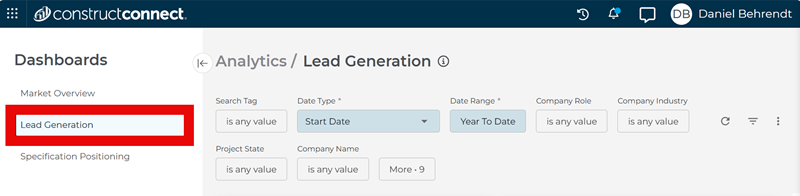
- In the Analytics workspace, select Company Targeting.
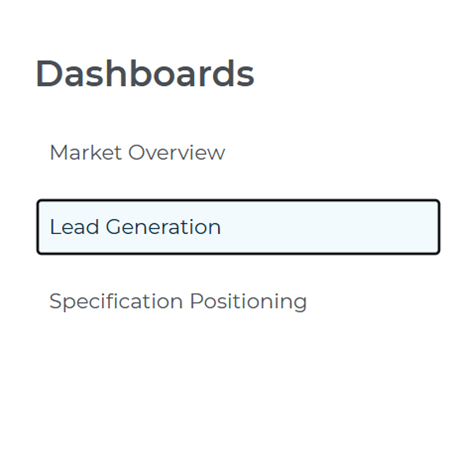
- Use the sidebar menu to switch between Company Targeting, Specification Share, and Market Overview as needed.
Choose search tags and filters
Use this section to build your initial company list for outreach.
The filters at the top of the dashboard control everything else on the page.
Select search tags

- In the Search Tag filter, choose one or more keyword-based search tags (up to 10 at once).
- These tags define which projects and companies appear in the dashboard. They’re created in Project Intelligence using saved searches and can be used to label projects or companies grouped by product keywords, competitor names, CSI codes, and other project criteria.
- Think of search tags as capturing what to look for (product, competitor, or CSI keywords), while the dashboard filters control where and when to look (stage, location, project value, and timing)
Note: To keep your tags flexible, focus them on document keywords (product names, competitor names, CSI codes) and avoid baking detailed stage, location, or date filters into the tags themselves. That way, you can reuse the same tags with different filter combinations across Analytics.
Use additional filters
- After you select search tags, use the other filters at the top of the dashboard (for example, Location, Role, Stage, Category, Type, and Start Date) to narrow the list to the companies you want reps to see.
- Use the Start Date filter to focus on projects scheduled to break ground in a specific window (for example, projects starting in the next 6–12 months) to support territory and capacity planning
- Use Company Role and Industry together to zerio in on the firms that matter most. Start by choosing a Company Role (for example, general contractors or specialty contractors), then use the Industry filter to narrow to relevant segments without scrolling through a long list of unrelated options.
- Use the CSI Division filter to narrow results to broad trade areas, such as Division 03 – Concrete or Division 08 – Openings.
- Click the More button (where available) to access additional project, company, or location filters.
Note: Any changes to your search tags or the dashboard filters will automatically update the metrics, charts, and tables on the page.
Review the AI summary
The AI Summary at the top of the dashboard provides a quick overview of key trends and insights based on your current filters.
Use it as a guide for where to focus your attention.
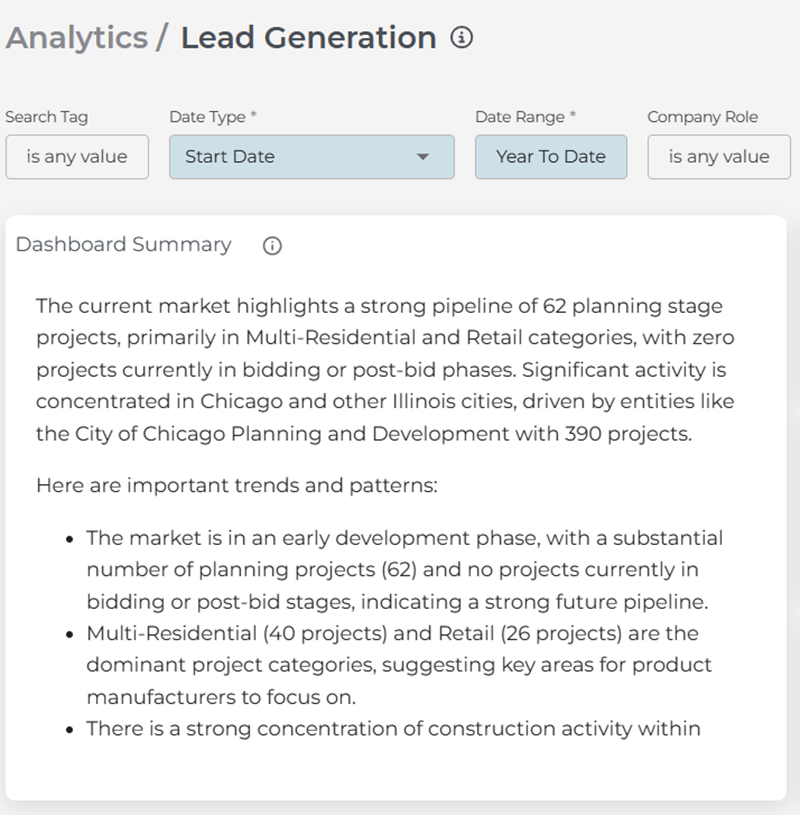
The summary updates automatically whenever you adjust your search tags or any of the filters at the top of the page, so you don’t need a separate step to refresh it.
Using the Target Company table
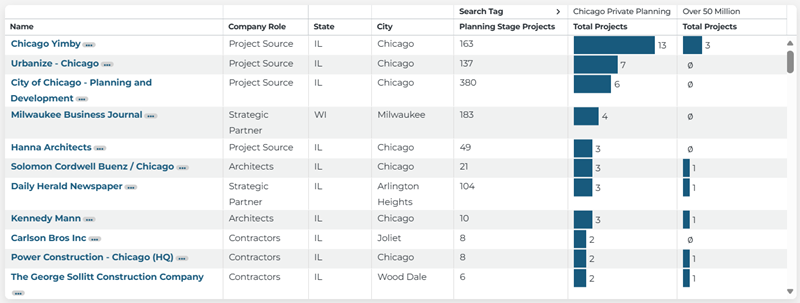
The Target Company table is where you’ll spend most of your time. It lists the companies that match your search tags and filters, along with the activity that makes them worth a closer look.
- Sort the table
- Click on any column header (for example, Total Projects or Planning Stage Projects) to sort data in ascending or descending order.
- Review the table using these columns
- Total Projects — Gauge whether the company has enough activity to justify outreach.
- Planning Stage Projects — See how many near-term opportunities are still early enough to influence. This column is sortable for quick prioritization.
- Use those values to answer these questions
- Is there still time to influence upcoming work? Review the company’s stage mix.
- Does this company work in areas where you compete? Review its category or trade exposure.
- Refine your results
If the companies shown aren’t the right fit, adjust your filters to focus your list:
Use the filters at the top of the dashboard to refine your main view:
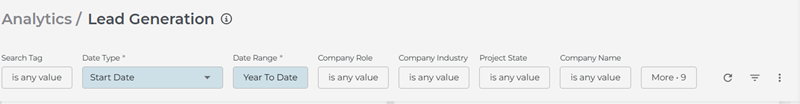
- Search Tags — Select or deselect tags to expand or narrow which projects and companies appear.
- Date Type and Date Range — Adjust the timeframe to emphasize near-term projects for pipeline building or include longer-term work when you are planning coverage and strategy.
- Company Role and Company Industry — Focus on the types of firms that matter most to your team.
- Project State — Expand or narrow the geographic area.
- Company Name — Jump directly to a specific company if you already know which account you want to review.
For additional filters, click More. Use these filters to narrow your results further:
- Project Type
- Project Category
- Project Subcategory
- Project Stage
- Project City
- Project County
- Company Size
- Company County
- Company City
Any changes you make to these filters will automatically update the metrics, charts, and tables on the page.

Open company details
Use this section when you want to look up or evaluate a specific company.
When you want to learn more about a company:
- In the Target Company table, click the company name.
- Or, use the Company Name filter at the top of the dashboard to jump directly to a specific company if you already know its name.
Then review the company details, including:
Project counts by stage – See how many projects are in planning, bidding, or post-bid.
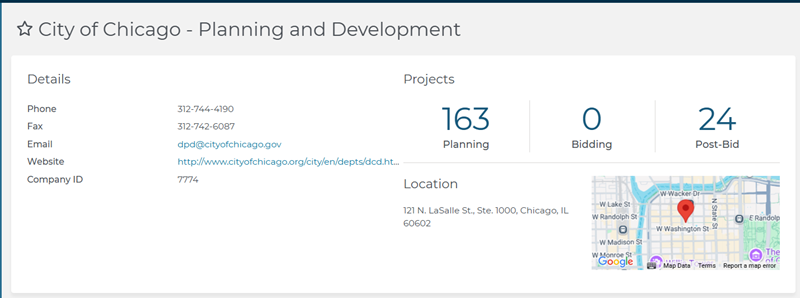
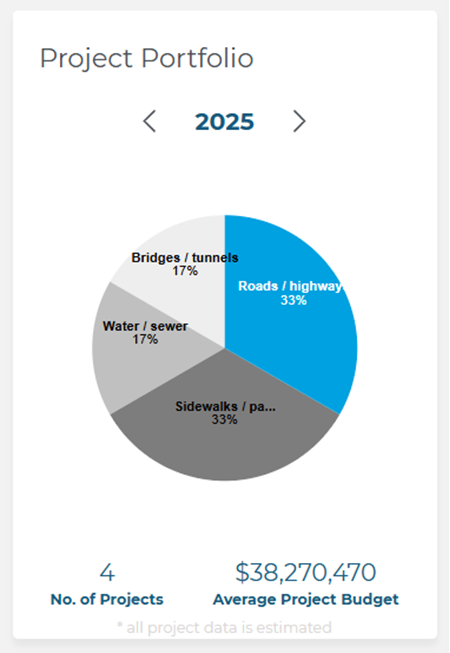
Category mix – Understand the types of work the company is involved in.
- Location and contact information – Quickly access basic company details.
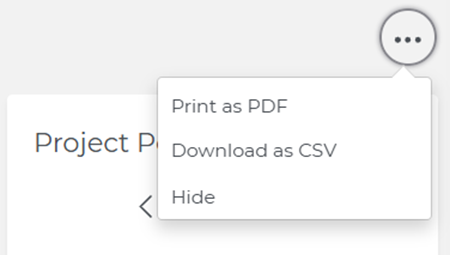
Take action from the Company Details page:
- Use options like Print, Download as CSV, or Hide.
- Explore the project list, just as you would from a search in Project Intelligence.
Use this view to decide which projects to reference and how to approach the company when you reach out.
View activity by category and momentum
The Project Activity section helps you see where activity is concentrated and how it is growing.
This section includes these tiles:
- Top 10 Categories — Review the categories or trades with the highest project counts in your current view.
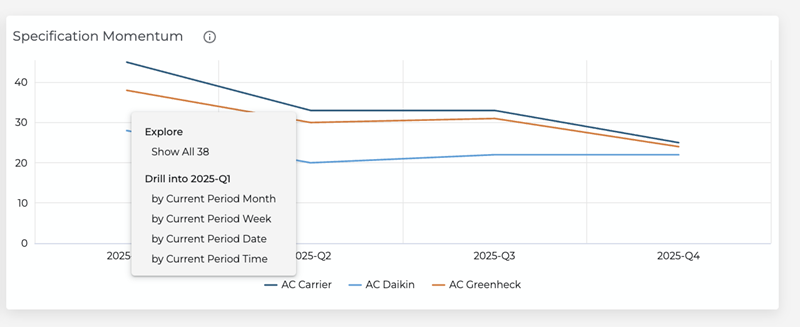
- Specification Momentum — Review the trend line to see whether activity for your selected search tags is increasing or decreasing over time.
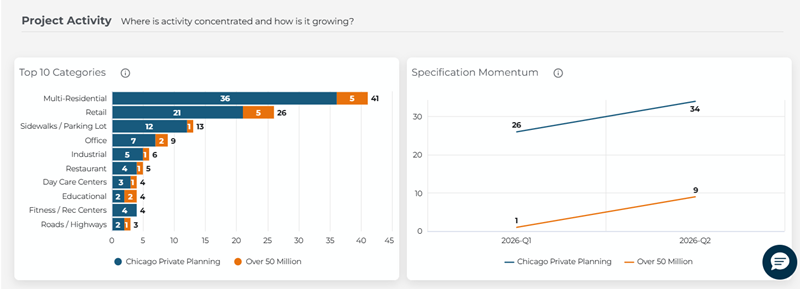
You can use these tiles to quickly spot concentration and momentum in the markets and project types you care about.
- Hover over a bar or line to see exact values.
- Click a bar or line point to drill down to the underlying list of projects.
Export and share your company list
Use this section to share your company list or move it into other tools.
After reviewing and refining the table:
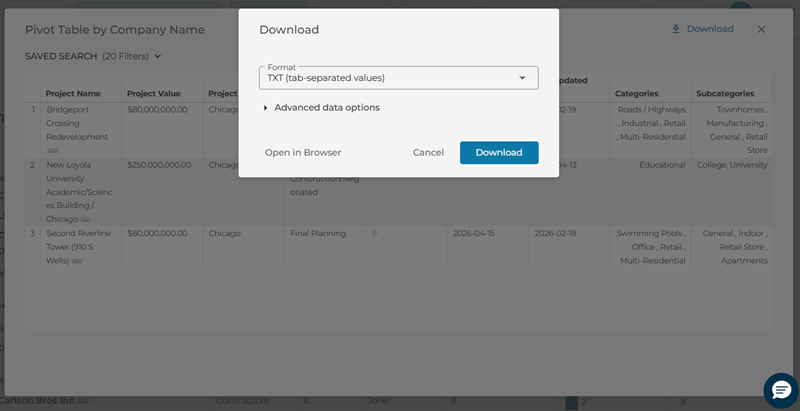
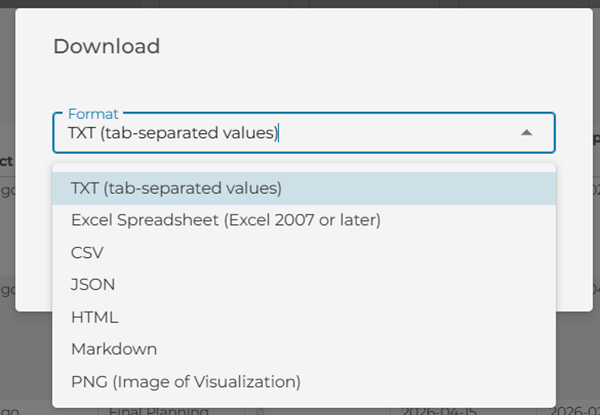
- Download your data using the export options:
- Company table – Get the full list of companies.
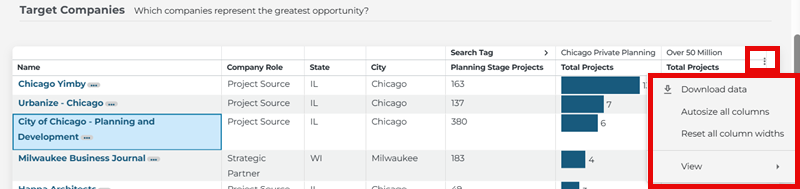
- Use the three-dot menu (ellipsis) on the far right of the company table to export to a spreadsheet format such as .csv or .xlsx.
- Project list – Export projects based on your current filters and tags.
- Click on a chart element or table bar to open a project list, then download that specific list of projects.
- Company table – Get the full list of companies.
Use the exported file to:
- Share with reps.
- Import into your CRM or calling tools.
- Attach to internal planning or strategy documents.
Every row in the exported table reflects your current filters and search tags, keeping your list aligned with the markets and projects you care about.
Getting help from inside Analytics
The Company Targeting dashboard includes built-in help so you can learn features as you use them:
- Use the speech bubble icon in the bottom right corner of the screen to send a question to our support team (select Project Intelligence in the Product Name drop-down for questions involving Analytics).
- Look for guiding questions in chart subtitles (for example, “Where is activity concentrated and how is it growing?”) to understand what each chart is showing.
- Hover over information (i) icons on metrics and charts to see definitions and calculation methods.
If you need additional help, search for “Analytics” or “Company Targeting” in the ConstructConnect Help Center.
 ConstructConnect Analytics Market Overview Dashboard in Project Intelligence ConstructConnect Analytics Specification Positioning Dashboard in Project Intelligence