ConstructConnect Analytics in Project Intelligence Release Notes (2026-18-05)
Construct Connect Analytics is now available on the ConstructConnect platform. This release helps users turn ConstructConnect’s U.S. and Canadian project data—enhanced with AI-generated summaries— into insights on high-value companies and shifting project activity, so organizations know which companies to prioritize and where market activity is shifting.
What's New
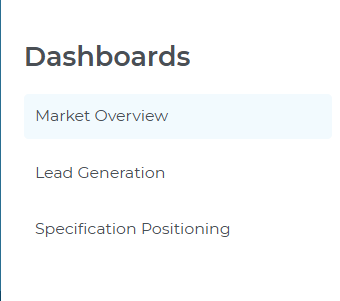
This release introduces a new Analytics section featuring three dashboards with interactive drill-down capabilities to project and company details.
- Lead Generation Dashboard – Identify prospects with active projects that match your trade, territory, and focus areas, so reps can prioritize the most promising companies.
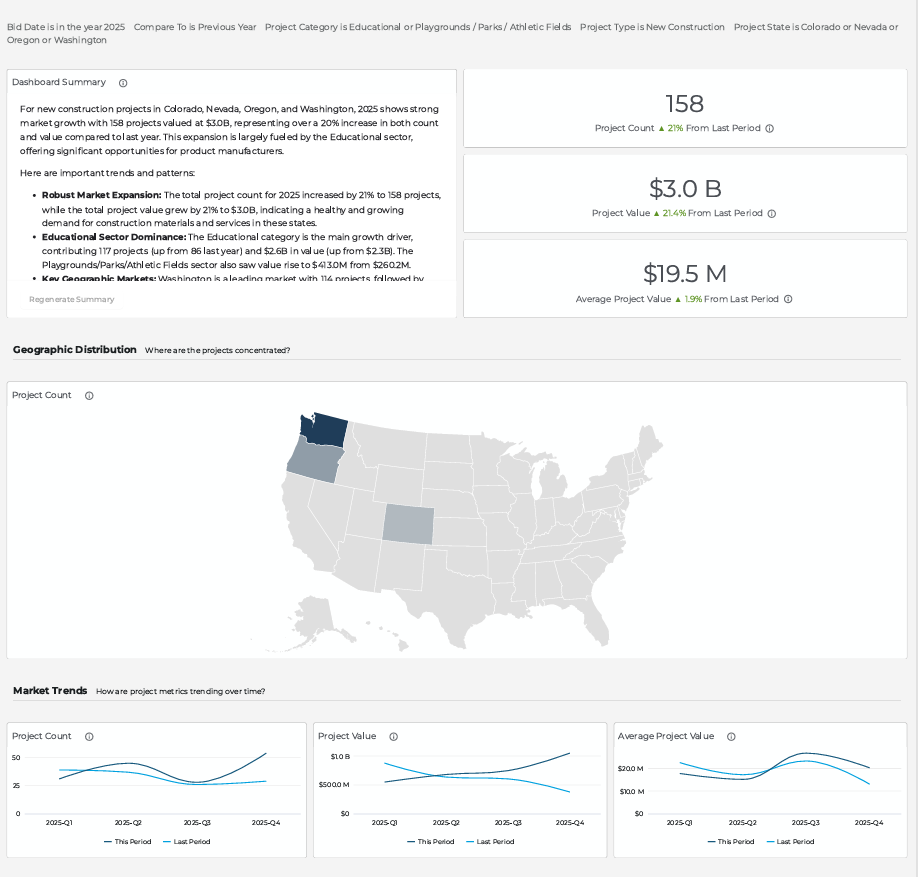
- Market Overview Dashboard – Track how project count and value change over time, by category and location, to support territory planning, coverage decisions, and leadership reporting.
- Specification Positioning Dashboard – Track how specification activity changes over time for your products and competitors, by category and company, so teams can spot share trends and identify where they are gaining or losing traction.
From each dashboard, you can move from a high-level summary to a filtered project list or directly to a Project or Company Details page in just a few clicks, keeping all your analysis in one place.
What You Can Do
With Lead Generation, you can:
- Apply saved search tags and filters to surface prospects matching your markets and products.
- Sort and filter company tables to quickly identify firms currently planning or bidding on projects your team can prioritize.
- Click into a company to review projects by stage — planning, bidding, or post-bid — as well as key contact details before reaching out.
With Market Overview, you can:
- Filter by date range, location, category, and stage to pinpoint the projects that matter most to your territory or portfolio.
- Track changes in project count, total and average value over time to spot trends and monitor performance.
- Click map regions or bar charts to see the projects behind each trend and access full project or company details.
With Specification Positioning, you can:
- Apply search tags and filters to track specification activity for your products, brands, and competitors across the markets you care about.
- Use Project Breakdown, Top Five Categories, and trend views to see where specification activity is concentrated and how it is changing over time.
- Click charts, comparison table rows, or company details to drill into the projects, companies, and contacts behind the data.
Highlights and Key Capabilities
Analytics includes:
- AI-powered summaries – Each dashboard opens with a headline and summary tailored to your filters, so you can quickly see what changed and where to look next.
- Interactive drill-down – Click any chart or metric to instantly access filtered project lists or detailed Project/Company pages, all without leaving the platform.
- Flexible filters – 10+ filters per dashboard across geography, project type, CSI division, company role, stage, and more, letting you customize views and uncover insights relevant to your sales and marketing questions.
- Integrated platform experience – Launch Analytics directly from the ConstructConnect navigation menu and move seamlessly between saved searches, project lists, and company records.
- Historical depth – Analyze 10+ years of project history to spot trends, measure performance, and make confident decisions based on past and current conditions.
You can check out the Related Articles section (below) for more detailed articles on individual dashboards within Analytics.
Related Articles
ConstructConnect Analytics Overview in Project Intelligence
ConstructConnect Analytics Market Overview Dashboard in Project Intelligence
ConstructConnect Analytics Lead Generation Dashboard in Project Intelligence
ConstructConnect Analytics Specification Positioning Dashboard in Project Intelligence